By using our website, you consent to your data being collected and used as outlined in our Privacy Policy.
Since 1999, the Healthcare Property Trust (Trust) has enhanced and extended existing healthcare infrastructure, including developing greenfield and brownfield sites to build new facilities.
By continuously looking for innovative solutions, the Trust seeks to meet the evolving needs of the community, the healthcare sector and our investors.
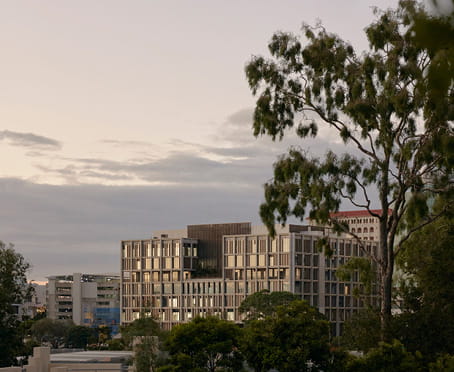
Image source: Surgical Treatment and Rehabilitation Service (STARS), Herston, QLD
The Healthcare Property Trust has received numerous awards from industry bodies investment research companies, governments bodies, and property councils.
Download Awards

General Manager | Healthcare Property Trust
View profileChris joined Australian Unity in 2001. He is responsible for all aspects of management for the Australian Unity Healthcare Property Trust, including strategy, asset management, property management, acquisition, and disposals.
Before joining Australian Unity, Chris was Regional Asset Manager Victoria for the Jones Lang LaSalle (JLL) Shopping Centre Division, following several years with JLL NSW and a successful 16-year career with Coles Myer.
Chris holds a Post Graduate Certificate of Business Administration from RMIT, a Certificate IV in Property Services (Real Estate), and is a licensed real estate agent.
LinkedIn

Acting Executive General Manager | Property Funds Management
View profileVijitha (Viji) Yogavaran was appointed Fund Manager of the Healthcare Property Trust (HPT) in January 2025 and currently serves as Acting Executive General Manager – Property Funds Management. Effective 9 July 2026, Viji will also assume the role of Acting Fund Manager for the Childcare Property Fund (CPF) and Student Accommodation Fund.
Viji brings more than 20 years' experience in real estate funds management, with deep expertise across asset management, capital transactions, treasury, finance, accounting and corporate governance. Since joining Australian Unity, she has demonstrated disciplined, values-led leadership and has played a central role in shaping the commercial strategy for the $3.3 billion healthcare and aged care property portfolios.
In her expanded role, Viji continues to lead the strategic direction of the Healthcare Property Trust and oversees the Childcare Property Fund and Student Accommodation Fund, with a strong focus on governance, risk management and investor outcomes. She is driving a range of value-maximisation initiatives to support the trusts' short-to-medium-term growth and long-term sustainability.
Prior to joining Australian Unity, Viji served as Fund Manager at Centuria Healthcare, where she managed a portfolio of healthcare property funds. She also held senior roles at Investa Property Group, working across an ASX-listed office fund, institutional mandates and Investa's balance sheet portfolio.
Viji is a member of the Chartered Institute of Management Accountants (CIMA) and the Association of Chartered Certified Accountants (ACCA).
LinkedIn

National Portfolio Manager | Healthcare Property Trust
View profileScott joined Australian Unity in January 2021 as a Senior Asset Manager and was promoted to National Portfolio Manager - Healthcare Property in 2024. He is responsible for the asset management of a national portfolio of healthcare assets within the Healthcare Property Trust and has over 25 years’ experience across all of the property markets around Australia.
Prior to joining Australian Unity, Scott was Director of Retail Management at Colliers, responsible for the leadership of the QLD Retail Real Estate Management business. He has also held Portfolio Manager and Senior Property Manager roles at JLL. He has extensive experience in property and asset management across retail, commercial, and alternative asset classes.
He holds a Bachelor of Commerce Property (Valuation) from Curtin University, and a Queensland Real Estate Licence.
LinkedIn

Fund Manager | Aged Care Property Trust
View profileJames is responsible for the management of Australian Unity's Aged Care Property Trust, having recently transitioned from an asset management role focusing on aged care and other healthcare properties.
He has 25 years’ experience in the management of listed and unlisted property trusts with a focus on healthcare property. He has held fund management, portfolio management, asset management, development financing, leasing, asset modelling, investment product creation and capital transactions responsibilities duringhis career.
Prior to re-joining Australian Unity’s Healthcare Property management team in December 2017, he was employed by Canadian listed group NorthWestHealthcare Properties REIT in an asset management capacity.
From 2004 to 2014, James was employed at Arena REIT (and predecessor groups Orchard FM and SAITeysMcMahon) as a fund manager and portfolio manager for various unlisted property funds primarily invested in healthcare property. This is James’ second term with the Australian Unity funds management business, having previously worked with the business from 1999 to2004.
His academic qualifications include a Bachelor of Business (Property), a Bachelor of Arts (Humanities) and a Master of Applied Finance.
LinkedIn

.png?h=220&w=330&hash=22EC7D5957086BEDDA4336A347AF5AFC)

In the 2025 financial year, Australian Unity delivered $2.38 billion in unique community and social value³. Our Impact showcases how we deliver on our purpose—to positively impact the wellbeing of millions—through our portfolio of health, wealth and care services.
³Source Our Impact 2025 report

Click below to view the contact details of our distribution team.
Visit distribution team
We have created additional resources to help you dig deeper into the subjects that are of most interest to you. Or you can browse relevant content to help plan your future.
